Devices
The Device page provides a real-time snapshot of your GateKeeper instance’s health and performance. The various widgets let you monitor and diagnose your GateKeeper device from a single, unified dashboard.
- In your web browser, open Blackwall GateKeeper’s login page.
- Authenticate using your user credentials.
- In the top menu bar of GateKeeper’s UI, click Device, which displays the Device overview page.
- Review all sections and widgets of the Devices page:
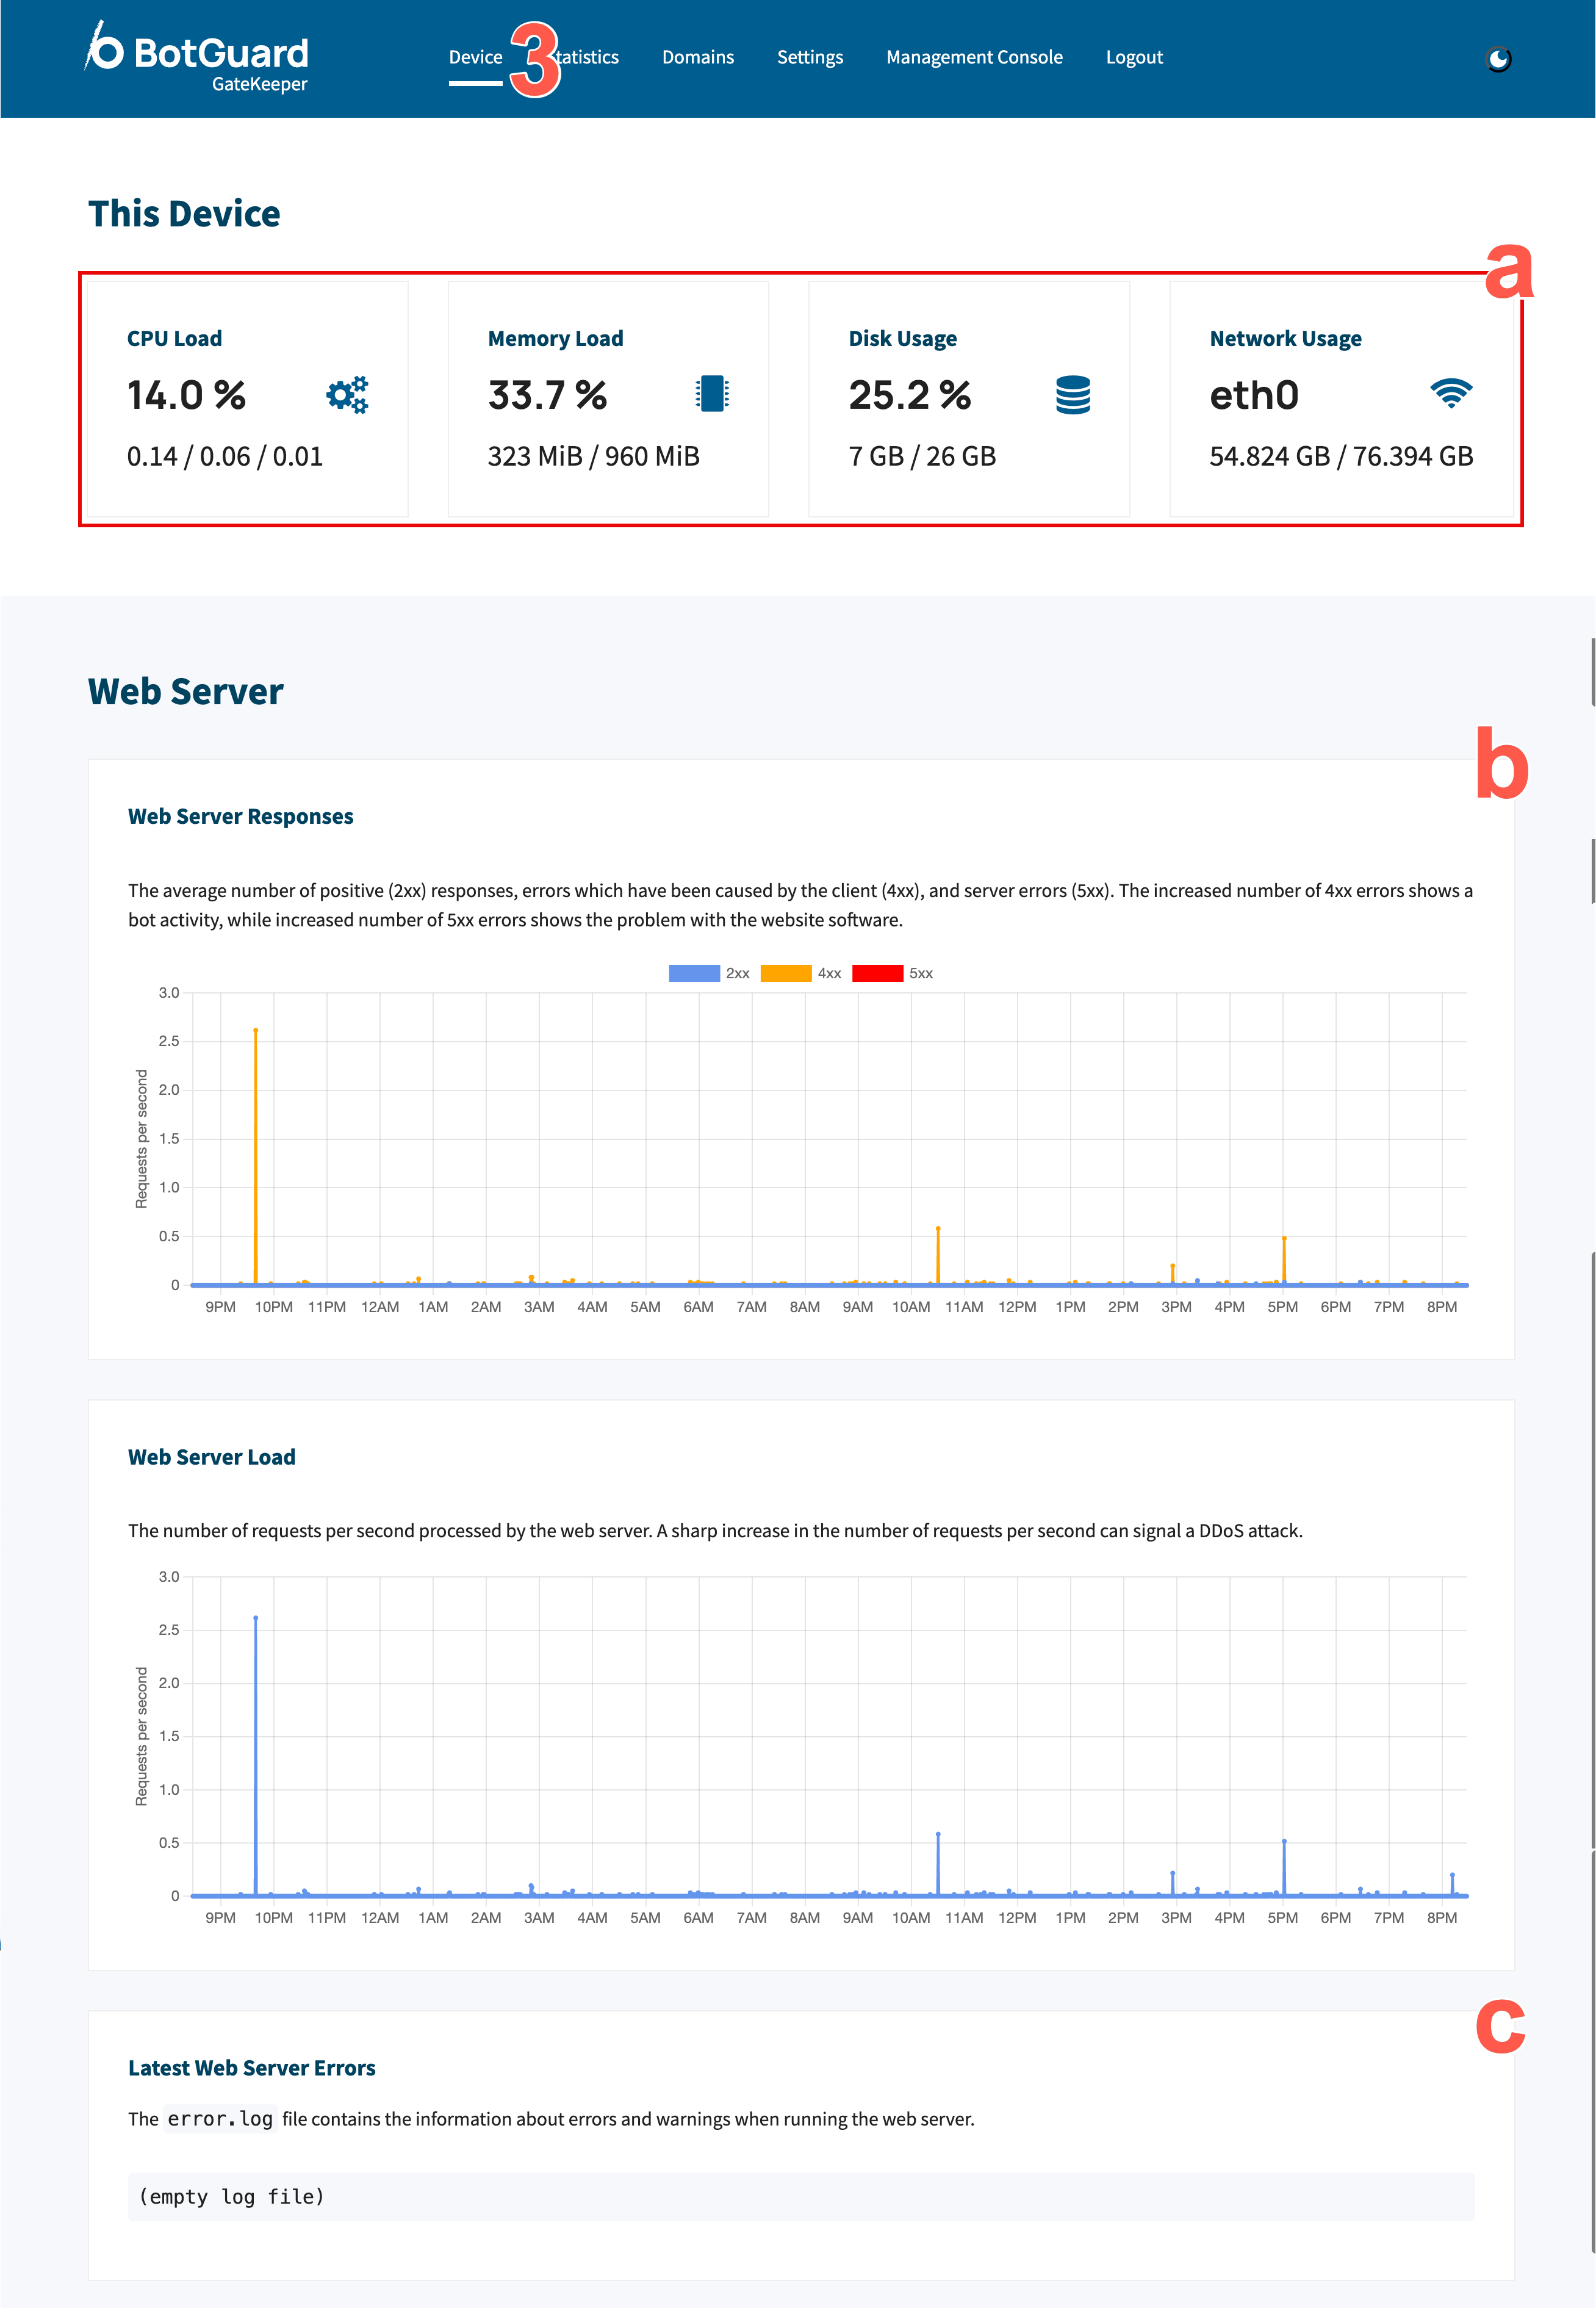
- In This Device at the top of the page, you will see four key system metrics widgets so that you can quickly spot resource constraints or unusual spikes:
- CPU load
- Memory utilization
- Disk usage
- Network throughput
- The Web Server panel breaks down both the volume and type of HTTP responses (2xx vs. 4xx vs. 5xx) alongside overall request-per-second load, enabling you to detect bot activity, client errors, server faults, or potential DDoS patterns at a glance.
- Finally, any recent server errors are surfaced in the Latest Web Server Error log, giving you immediate visibility into warnings or failures that may require troubleshooting.
- In This Device at the top of the page, you will see four key system metrics widgets so that you can quickly spot resource constraints or unusual spikes: